Guide · yield
How much electricity do solar panels make in North Wales?
Whether or not a grant is involved, the value of solar starts with how much electricity the panels make. Here are independent estimates for each North Wales council area, how they were worked out, and why your own roof will differ.
In brief
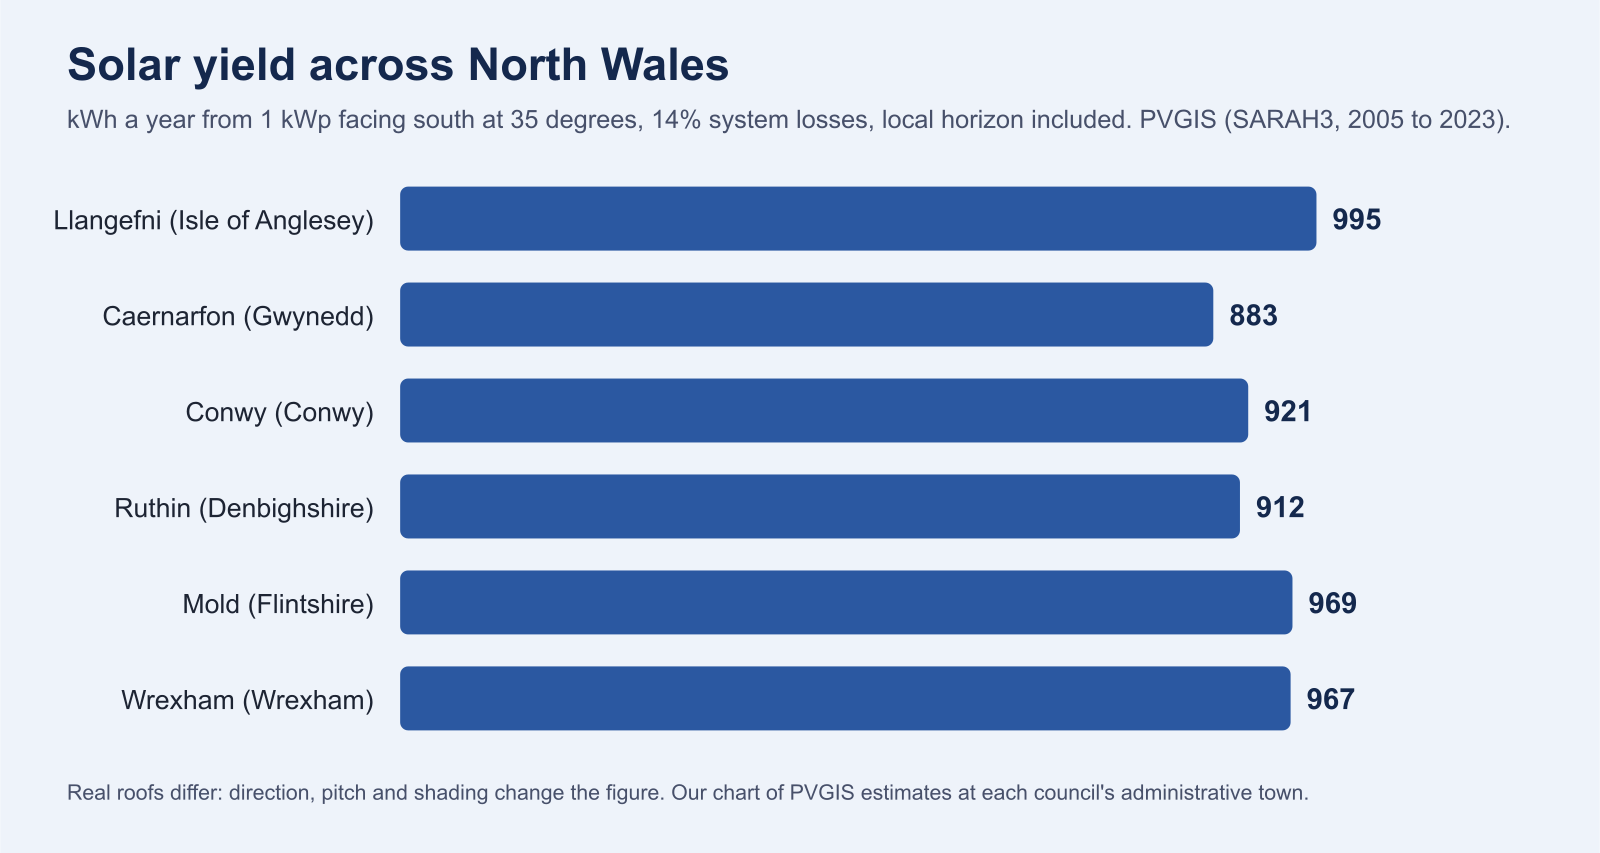
By PVGIS's estimates, a kWp of panels facing south at 35° makes about 883 to 995 kWh a year across North Wales: highest near Llangefni on Anglesey, lowest near Caernarfon. Your roof's direction, pitch and shading change the figure, so rely on an MCS installer's written estimate for your home.
Checked at source on 3 November 2026 · An independent guide from SEO-DONS LTD, not the Welsh Government, Nest or a council
The figures
Six towns, six estimates
| Council area | Near | kWh per kWp a year |
|---|---|---|
| Isle of Anglesey | Llangefni | 995 |
| Gwynedd | Caernarfon | 883 |
| Conwy | Conwy | 921 |
| Denbighshire | Ruthin | 912 |
| Flintshire | Mold | 969 |
| Wrexham | Wrexham | 967 |
PVGIS v5.3, SARAH3 satellite data for 2005 to 2023, 1 kWp of crystalline silicon panels facing due south at 35°, 14% system losses, with PVGIS's terrain horizon. Read 3 November 2026.
How it's worked out
What PVGIS is, and what we asked it
PVGIS is a free tool from the European Commission's Joint Research Centre that estimates how much electricity a solar system will produce at a given location, using satellite records of sunshine. We asked it the same question for each of the six administrative towns: a 1 kWp system, facing due south, tilted at 35°, with 14% allowed for losses in cabling, the inverter and dirt, and with the local horizon included, so that hills cutting off low sun are taken into account.
Using one standard system makes the areas comparable. It also means the figures describe a good roof, not your roof. Multiply by your system's size in kWp for a rough yearly total: a 4 kWp system near Mold would be around 3,900 kWh on these assumptions.
Why they differ
Anglesey high, Caernarfon low
The spread across North Wales, about 13% from lowest to highest, is modest. The island of Anglesey comes out highest at about 995 kWh near Llangefni; Mold and Wrexham, in the north-east, follow at about 969 and 967. Conwy and Ruthin sit in the low 900s, and Caernarfon is lowest at about 883.
The horizon is part of the reason. PVGIS includes the surrounding terrain, so a town with high ground nearby loses some early and late sun. A home on a hillside facing the sea might do better than its town's figure; one in a narrow valley worse.
Your roof
What changes the figure for a real home
- Direction. East or west-facing roofs make less than south-facing ones, but often still worthwhile amounts, and spread generation across the day.
- Pitch. Steeper or flatter than 35° changes the yearly total a little and the seasonal pattern more.
- Shading. Chimneys, trees and neighbouring buildings can cut output, sometimes by more than the difference between towns.
- Equipment and losses. Panel, inverter and cabling losses may be higher or lower than 14%.
That's why an MCS certified installer's survey and written performance estimate matter more than any area figure.
What it's worth
From kilowatt-hours to bills
Generation turns into value in two ways. Electricity you use as it's generated replaces electricity you would buy; electricity you don't use is exported, and under the SEG a supplier pays for it if the installation is certified and metered. Self-use is usually worth more per unit than export, so the shape of your day matters as much as the yield.
We don't publish savings figures of our own, because they depend on your tariff and habits. Ask any installer to show how its estimate splits between self-use and exports, and which prices it assumed. See export payments and VAT.
Check it yourself
Run PVGIS for your own roof
PVGIS is free and public. Enter your address, your roof's direction as an azimuth (south is 0, east −90, west 90) and its pitch, and it will estimate a year's output and a month-by-month pattern. It's a good way to sense-check an installer's estimate, which should be in the same region for a similar system. For the area figures in context, see the six council areas.
Seasons
Summer and winter
A year’s total hides a big seasonal swing. In North Wales, as across the UK, panels make most of their electricity between spring and early autumn, and much less in December and January, when days are short and the sun is low. PVGIS gives a month-by-month breakdown for any location.
That pattern matters for planning. A household that uses most electricity in winter, perhaps with electric heating, will use less of its own generation than the yearly total suggests, and export more in summer.
Comparing estimates
Using the figures to test a quote
If an installer’s estimate for a south-facing roof is far above the PVGIS figure for your area multiplied by the system size, ask how it was worked out. A higher figure isn’t necessarily wrong, but it should have a reason.
Equally, if your roof faces east or west, or is partly shaded, expect a lower figure than the table, and be pleased rather than suspicious if the installer says so.
Battery or not
Yield and storage
A battery doesn't change how much the panels generate; it changes how much of it you use yourself, by storing daytime surplus for the evening. In summer, when North Wales panels produce most, that can make a real difference to self-use; in midwinter there's often little surplus to store. Ask any installer quoting a battery to show the estimate with and without it, so you can see what it adds for your household. Installed batteries in homes are zero-rated for VAT until 31 March 2027, like the panels.
Either way, the yield figures here are a starting point for the conversation, not a substitute for a survey of your own roof by a certified installer.
Checked against
- PVGIS solar estimates (SARAH3, 2005 to 2023) (EU Joint Research Centre), read 3 November 2026
- SEG guidance for generators (PDF) (Ofgem), read 2 November 2026
- find a certified installer (MCS), read 3 November 2026
Not sure which scheme, if any, fits your home?
Tell us which council area you're in and what you're looking into. Your message reaches SEO-DONS LTD, the publisher of this guide, and we answer by email. We're not a scheme and can't approve anything, but we can point you to the right one.
What happens next
- Your message reaches SEO-DONS LTD, which publishes this guide.
- We reply by email with the scheme page that fits, if there is one.
- Any application is between you and that scheme.